| |
Re: Label base of 3d column chart
|
| |
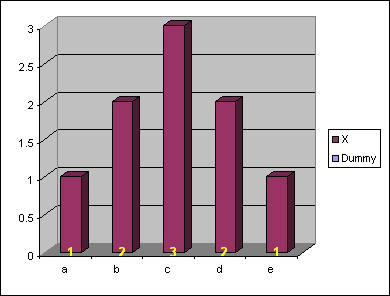
This is a
standard stacked 3d column chart
|
| |
A |
B |
C |
| 1 |
|
Dummy |
X |
| 2 |
a |
0 |
1 |
| 3 |
b |
0 |
2 |
| 4 |
c |
0 |
3 |
| 5 |
d |
0 |
2 |
| 6 |
e |
0 |
1 |
Select the range A1:C6 and
use the chart wizard to create a standard 3d stacked column
chart
|
| |
|
|
|
 |
|
Select the Dummy data series
and apply data labels. As this series has a zero values the data
labels although displayed in the center of the column appear to
be at the base of the real data.
|
|
 |
|
|
In order to make the data
labels display the values of those of the second data series we
will have to change the text.
You could edit each data label manually. Or link each data label
to a cell manually.
But try this
addin to save the effort of doing things manually.
|
|
|
 |
|
|
Once the labels have the
correct data displayed you can format them as required.
|
|
|
 AJP Excel Information