

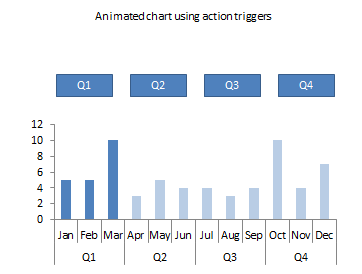
Animated chart in PowerPoint
I replied to a post on Chandoo.org by Chirayu on animating a chart in PowerPoint.
My suggestion was that VBA code was not required to alter the stack of images. Instead you could use the built in animated effects and triggers to display the required view of the select quarters data and hide the others
 Here is the animation pane showing the effects and triggers which
vary which of the chart objects on the slide are shown at any one
time.
Here is the animation pane showing the effects and triggers which
vary which of the chart objects on the slide are shown at any one
time.Also as an alternative to the VBA suggestion of altering the stack of images I used VBA to manipulate the chart series.
The data within the chart needs to be layout as shown below. This will then create 5 series of columns. The Data series is used to display the out of focus columns for all months. The other 4 series are used to display each quarters data only.

The following VBA code is used to control the transparency of the quarter series.
Option Explicit
Sub FormatChart(VisibleSeries As String, HiddenSeries As Variant)
Dim item As Variant
With ActivePresentation.Slides(1).Shapes("Chart 3").Chart
.SeriesCollection(VisibleSeries).Format.Fill.Transparency = 0
For Each item In HiddenSeries
.SeriesCollection(item).Format.Fill.Transparency = 1
Next
.Refresh
End With
End Sub
Sub Q1_Click()
FormatChart "Q1", Array("Q2", "Q3", "Q4")
End Sub
Sub Q4_Click()
FormatChart "Q4", Array("Q1", "Q2", "Q3")
End Sub
Sub Q3_Click()
FormatChart "Q3", Array("Q1", "Q2", "Q4")
End Sub
Sub Q2_Click()
FormatChart "Q2", Array("Q1", "Q3", "Q4")
End Sub
Each of the Quarter shapes can then have a action assigned to them.