

| |
| |
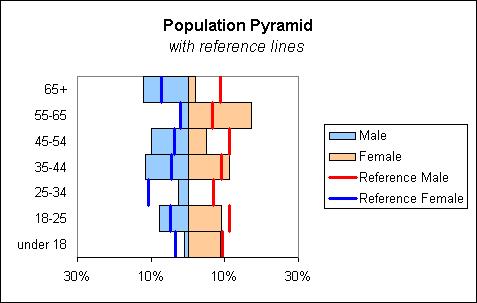
Re: Population pyramid with reference line
|
| |
The
download contains a
population pyramid with a set of reference lines. The reference
lines are two additional sets of data chart on the secondary
axis as a xy-scatter.
I have made the assumption
that each age break by sex has it own reference value.
|
| |
|
|
|
|
|
|
Created August 2004
Last updated 5th August 2014
 AJP Excel Information


