Converting BMP image files to XY-Scatter chart
The two workbooks take a normal BMP image file and load it into Excel either as XY-scatter chart or directly into a worksheet.XY-Scatter chart
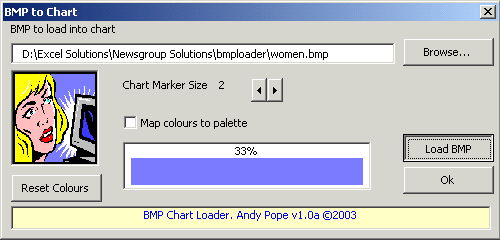
The program reads the BMP file and then analyses the colour content.
As long as the image contains 56 or less unique the colours it will be plotted.
Depending on the image size you may need to increase the markers in order to fill in white space. Or reduce the size to stop overlapping.
Also adjusting the plot area size can reduce banding when the markers are too far apart.
The .zip file also contains a few bmp images to use for testing
This is the result:

Worksheet Cells
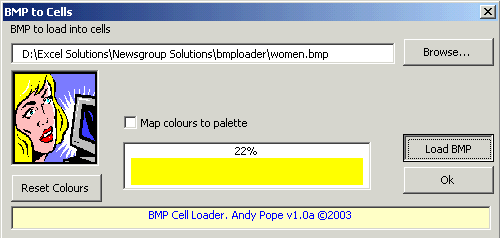
The process is similar to the xy-scatter chart.
This is the result:
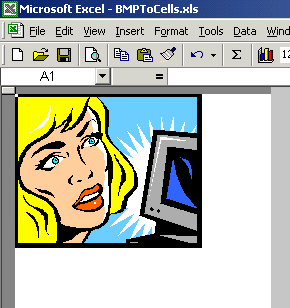
Chart example

Worksheet cells example


