
| |
| |
Re: Displaying 2 straight lines

|
| |
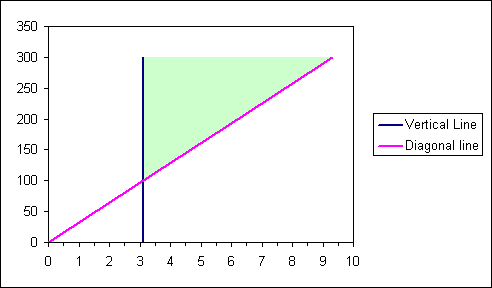
The
workbook contains a step by step explanation.
The combination chart uses a
xy scatter to draw the lines. The fill is created using 2
additional area chart data series.
|
| |
|
|
|
|
|
|
Created August 2004
Last updated 5th August 2014
 AJP Excel Information

