
| |
| |
Re: OHLC axis labels
|
| |

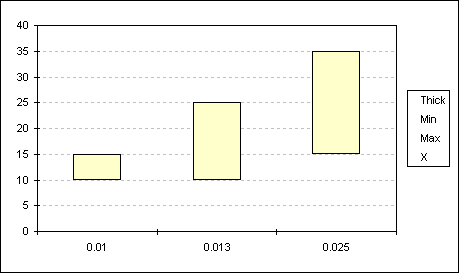
This is a
standard OHLC chart is.
|
| |
A |
B |
C |
D |
E |
| 1 |
|
Thick |
Min |
Max |
X |
| 2 |
0.01 |
10 |
10 |
15 |
15 |
| 3 |
0.013 |
10 |
10 |
25 |
25 |
| 4 |
0.025 |
15 |
15 |
35 |
35 |
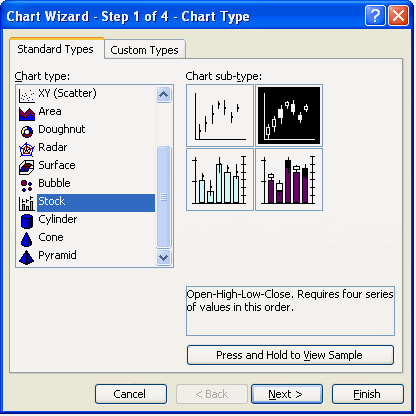
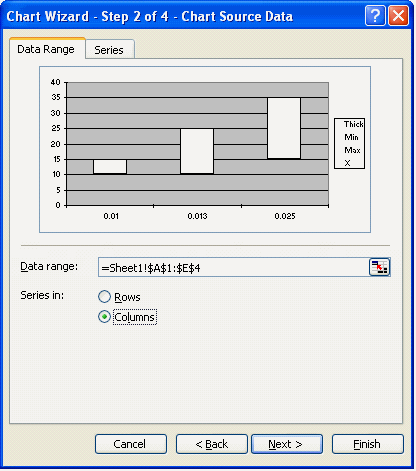
Select the range A1:E4 and
create a standard stock chart of the OHLC sub-style.

The data series
are in columns.

|
| |
|
|
|
|
|
|
Created August 2004
Last updated 5th August 2014
 AJP Excel Information

