
| |
| |
RE: replace axis text with graphics on excel chart (excel
2003)
|
| |
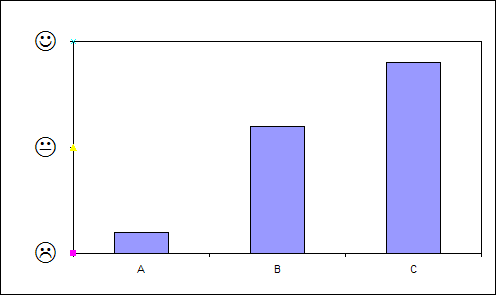
You can use
additional data series plotted as xy scatter. The data label
then displays the series name formatted in Wingdings font.
Here is a
example |
|
|
| |
|
|
|
|
|
|
Created August 2004
Last updated 5th August 2014
 AJP Excel Information

