| |
When data labels are
linked to cells that are not those used for the Category or
Series text and the data is filtered the displayed text if
incorrect. This is because the actual points displayed are
always sequential.
So if
points 1, 2 and 3 are showing and you then filter out point 2
what is displayed is 1 and 2 rather than 1 and 3. Obviously the
actual values used are correct but the linked labels become
incorrect.
To avoid this
problem you can use some helper columns that automatically
revise the order of the linked labels.
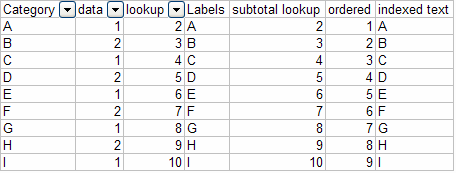
The following is an example data set including helper columns.
The actual chart is based on first 2 columns.
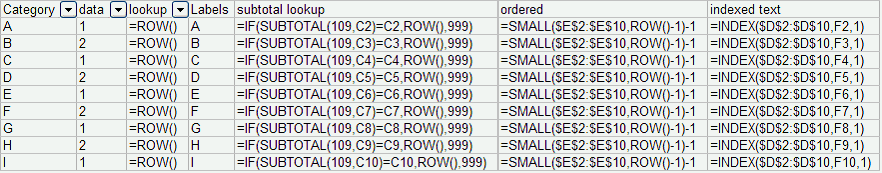
And here are the
formula used to create the Indexed text.
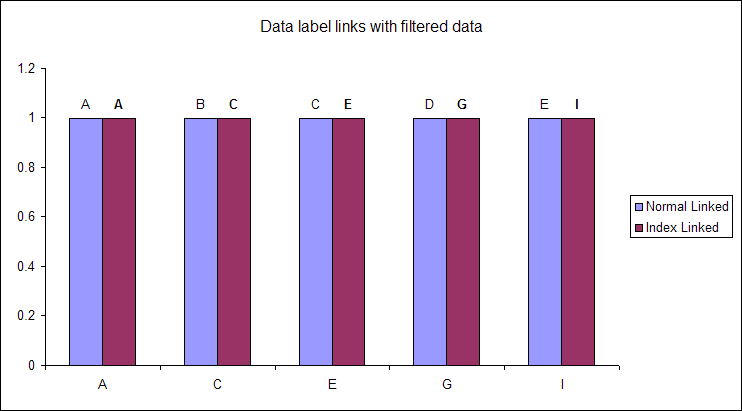
And this is what the chart looks
like unfiltered. The first series has it data labels linked to
the Labels column. The second series is linked to the Indexed
text column.

When the data is filtered on Data = 1 you can see the normally
linked data labels are incorrect but the Indexed labels work.
This is because the SUBTOTAL formula returns different values if
the row is hidden. For visible rows the actual row number is
returned otherwise a value greater than the last row, I used
999, is returned.
The Ordered column then uses this value to create a row index
value used in the INDEX formula. Because the formula is also in
the rows that are filtered you can not see the complete set of
labels.
Here is the data filtered on Data =1
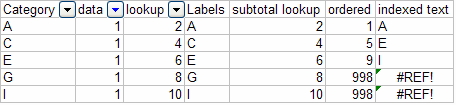
You can see the second data
series in the chart displays the labels of the filtered rows.
For information on
linking data labels to cells.
Free add-in
|
 AJP Excel Information


